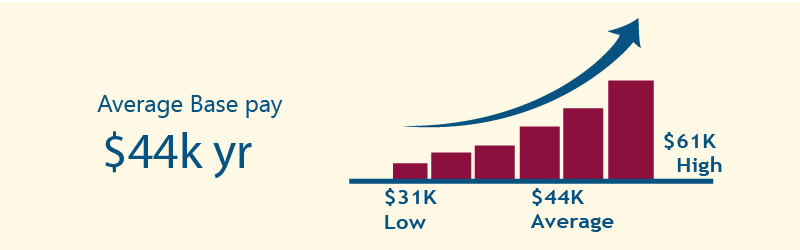
Learn online courses from home and let opportunities knock your door.

Angular Google Charts Training

4.5 3572 Reviews
Angular Google Charts Training

Angular Google Charts Course

Angular Google Charts training is a course in which you will learn about simple tool to make charts for different purposes. The tool will help you to make different types of charts like bar chart, pie chart, line chart, etc. You need to have the knowledge of HTML, CSS, and JavaScript so that you can learn the tool easily. The course has been designed for those people who want to analyze data with the help of charts and then create reports accordingly. The jobs that you can get after doing this course is web developer, software engineer, web application developer, and many more.

Course Overview

Angular Google Charts Course from QTSInfo will let you know the development of various types of charts. The chart will be shown in its default look and you will have the option to customize it using various features.

The course will let you know about all the features of the tools. The course will be taken up live by our expert instructors and you can schedule your classes according to your timetable. The course will also include mock tests and mock interview sessions and this will help you in practicing the exam and interview questions.

Angular Google Chart Certification Key features

  • The support staff will answer your queries 24/7
  • Demo sessions will be arranged prior to the course
  • Know the basics and advanced concept of Angular Charts
  • Arrangement of practical classes will be done along with theory
  • A job placement facility is available
  • Resume development facility is available

Who should learn Angular Google Chart Course?

People who want to make reports in the form of graphs can do the course. The course has been designed for fresh graduates and experienced professionals.

Top Hiring Company
Companies
Industry Trends
Top Hiring Companiess

Course curriculum / Syllabus

Introduction
  • Introduction to Google Charts
  • API Syntax
First Pie Chart Example
  • Creating Basic Pie Chart
  • Generate Code of Pie Chart
  • Run Basic Pie Chart
Bubble Chart Example
  • Bubble Chart Example
  • Google Charts
  • Simple Bar Chart
  • Annotation Rule
  • Stacked Bar Chart
Interacting with charts
  • Events in Charts
  • Select Events
  • Definition of Select Function
  • How Function Works

Angular Google Charts Training FAQ’s:

1.Is it possible to organize practical classes?

Yes, we know. Instructors will present live demonstrations, and you can practice your skills.

2.Do you offer flexible working hours?

Yes, we do. We offer flexible working hours. You can choose the suitable schedule.

3.Can I do a project during the course?

Yes, we know. Projects are prepared for you and you will complete them with the help and guidance of your tutor.

4.Can I change the course syllabus?

Yes, you can change the course syllabus.

5.Who prepares the curriculum?

Our professional trainers are responsible for tailoring the course curriculum.

Related Courses

Why QTS INFO

Best Virtual training classrooms for IT aspirants

Real time curriculum with job oriented training.

Around the clock assistance

We are eager to solve your queries 24*7 with help of our expert faculty.

Flexible Timings

Choose your schedule as per your convenience. No need to delay your work

Mock projects

Real world project samples for practical sessions

whyqts